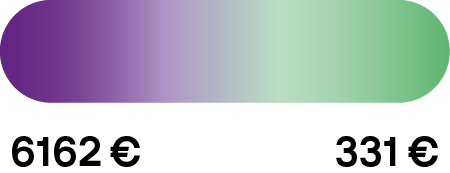
COPD is costly for patients, the healthcare system and society as a whole (Figure 5) [1]. Due to its high prevalence and mortality rate, COPD’s direct cost accounts for 6% of total healthcare spending in the European Union (equivalent to €38.6 billion per year) and 56% of the total cost of treating respiratory diseases [2]. It is estimated that, between 2020 and 2050, COPD will cost the world economy INT$4·3 trillion. A thorough understanding of the economic implications of COPD is a prerequisite for sound, evidence-based policy making [1]. Furthermore, costs related to medications and hospitalisations are only a fraction of the burden of COPD. The real costs of COPD remain underreported and may be underrepresented due to underdiagnosis.

